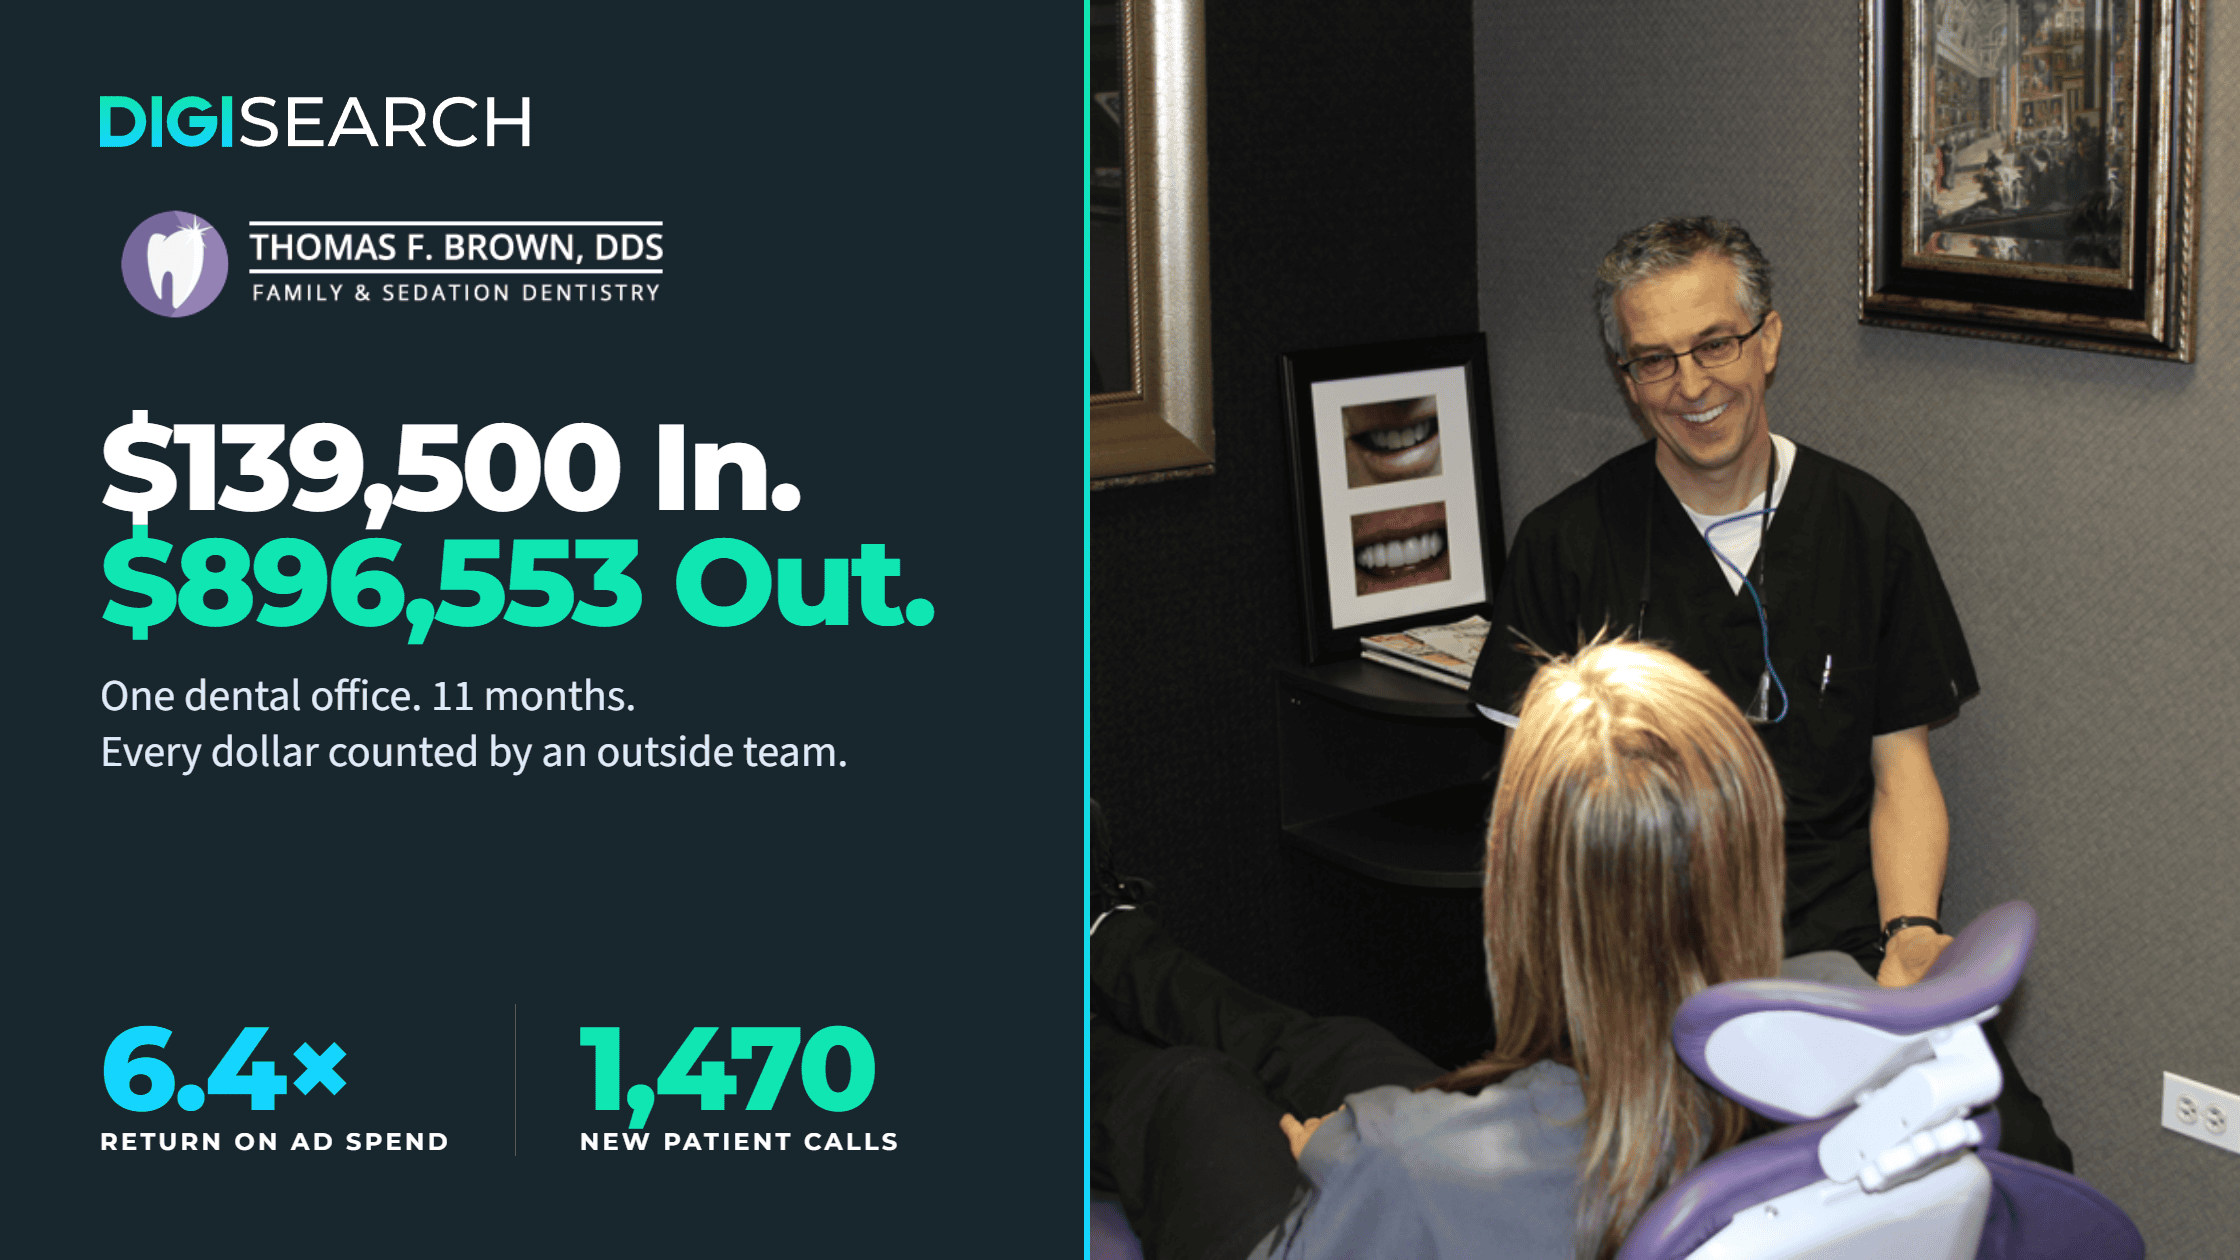
This dental marketing case study documents eleven months of results for one dental practice. Every number below was measured by Liine, an independent ROI platform installed at the practice that tracks each inquiry, appointment, attended visit, and dollar of production back to its source. Most dental marketing reports stop at the click. This one does not.
Total ad investment: $139,500.
First-year patient production tied to that investment: $896,553.
Return on ad spend: 6.4x.
The rest of this post explains how that number was built, and, as importantly, what an independent measurement layer reveals when a partnership is under real scrutiny.
Eleven Months on the Record
Between August 2025 and June 2026, the SmartReach™ system generated 1,470 new patient inquiries for Dr. Thomas F. Brown DDS in Naperville, Illinois. Monthly demand grew 110%, from 105 inquiries per month in the first stretch to a record 220 in March. Average first-visit value held at $420 across the entire window, inside a narrow band of $357 to $533. Scaling the budget scaled the patient count without diluting the patient value.
When the practice doubled its investment in January, from $8,100 to $16,500 per month, demand scaled with it. Inquiries went from a five-month average of 105 to peaks of 156, 163, 220, and 171 across the next four months. The system responded to the input predictably. That is the point of a system.
The Same Patients, Three Months Later
In April 2026, the August-through-March patient cohort measured $498,984 in first-year production. Three months later, with zero additional advertising spent on those same patients, the same cohort measured $792,291. That is a 59% jump on $0 in incremental ad cost.
The growth came from patients returning for treatment, accepting care plans, and referring family members. The ad dollar bought the first visit. Everything after was the practice keeping patients and the system continuing to produce revenue the campaigns had already earned.
Every Channel Has a Job
The results above did not come from one channel. They came from the full funnel working together. NextGen TV™ built awareness on home television screens throughout the target area. Meta Ads reinforced the brand and captured interest-stage patients earlier in the decision. Verified Ads™ and Search Ads captured the patients ready to act. By the time a caller reached the front desk, that patient had already chosen the practice; the phone call was the last step, not the first.
This is the same architecture documented in the earlier eight-month snapshot of the Brown partnership, which measured $213,690 in organic-channel patient revenue attributable to television awareness. The eleven-month numbers are the same architecture, further along.
The Freeze, and the Save
In late spring 2026, the practice’s Verified Ads™ account was frozen. The cause sat outside anyone’s dashboard: two associate doctors had stalled on the ad platform’s provider identity verification process, and that platform halts an entire account until every listed provider verifies. Inquiries from the practice’s highest-volume channel fell to near zero in June.
DIGI Search caught it, diagnosed it, and made the call. Remove the two unverified doctors from the account, restore the listing under the two providers already verified, and restart the channel. Verified Ads™ was live again in July.
A dashboard shows a practice that a channel stopped. A partner finds out why, makes the decision, and turns it back on.
The Finding an Ad Report Will Never Show
For the first seven months of the campaign, the practice returned new patient calls within one to two hours. Show rates ran 78% to 85%. Mid-year, callback times slipped to six to ten hours. Show rates fell to 55% to 69% in the same window. DIGI Search identified the pattern, quantified it, and raised it with the practice repeatedly.
Across eleven months, 171 patients booked an appointment and then cancelled or did not show. At the measured average of roughly $1,800 in first-year production per attended patient, that is approximately $300,000 in production the marketing already earned, waiting to be recaptured through faster callbacks, same-day confirmations, and consistent reminders.
That finding pointed at the practice, not the campaigns. It was still reported in full. DIGI Search measures the entire patient acquisition chain, from the first impression to the chair, because that is where campaigns are actually won or lost. No advertising line item buys that visibility.
One Practice, Eleven Months, Full Accountability
Every figure above was measured on an independent layer both sides can trust. Ad spend and production. Demand and value. Growth and slowdown. Wins and misses. The partnership between Dr. Brown’s practice and DIGI Search is now in its tenth year, still on month-to-month terms with no long-term contract. The results are what keeps it renewed.
Schedule a discovery call to review the numbers behind this partnership approach and what they could look like for a specific practice.