Most dental practices track marketing across a stack of tools. Google Ads in one tab, Google Business Profile insights in another, social platform dashboards in a third, email in a fourth, and a call-tracking spreadsheet somewhere in between. The data is there. The picture is not.
That gap is the reason so many practice owners cannot answer a simple question about their own marketing. Which channel actually brought in last month’s implant case? Which piece of the budget is carrying the rest? What would happen to patient volume if a single channel got cut in half?
The SmartReach™ system was built to make those questions answerable at the campaign level. The SmartReach AI™ dashboard is what makes them answerable at a glance.
The Reporting Problem Most Practices Live With
A practice running four or five channels ends up with four or five different definitions of a lead, four or five different conversion windows, and four or five different opinions on which channel deserves credit for the patient who called last Tuesday.
The end result is common. A monthly report that shows every channel performing well individually, alongside a bank account that says something different. Or a channel-by-channel spreadsheet that adds up to more inquiries than the front desk actually took.
Multi-channel dental marketing rarely fails at the channel level. It fails at the reporting level, where no single number ties the channels together into a picture a practice owner can trust.
What the SmartReach AI™ Dashboard Shows
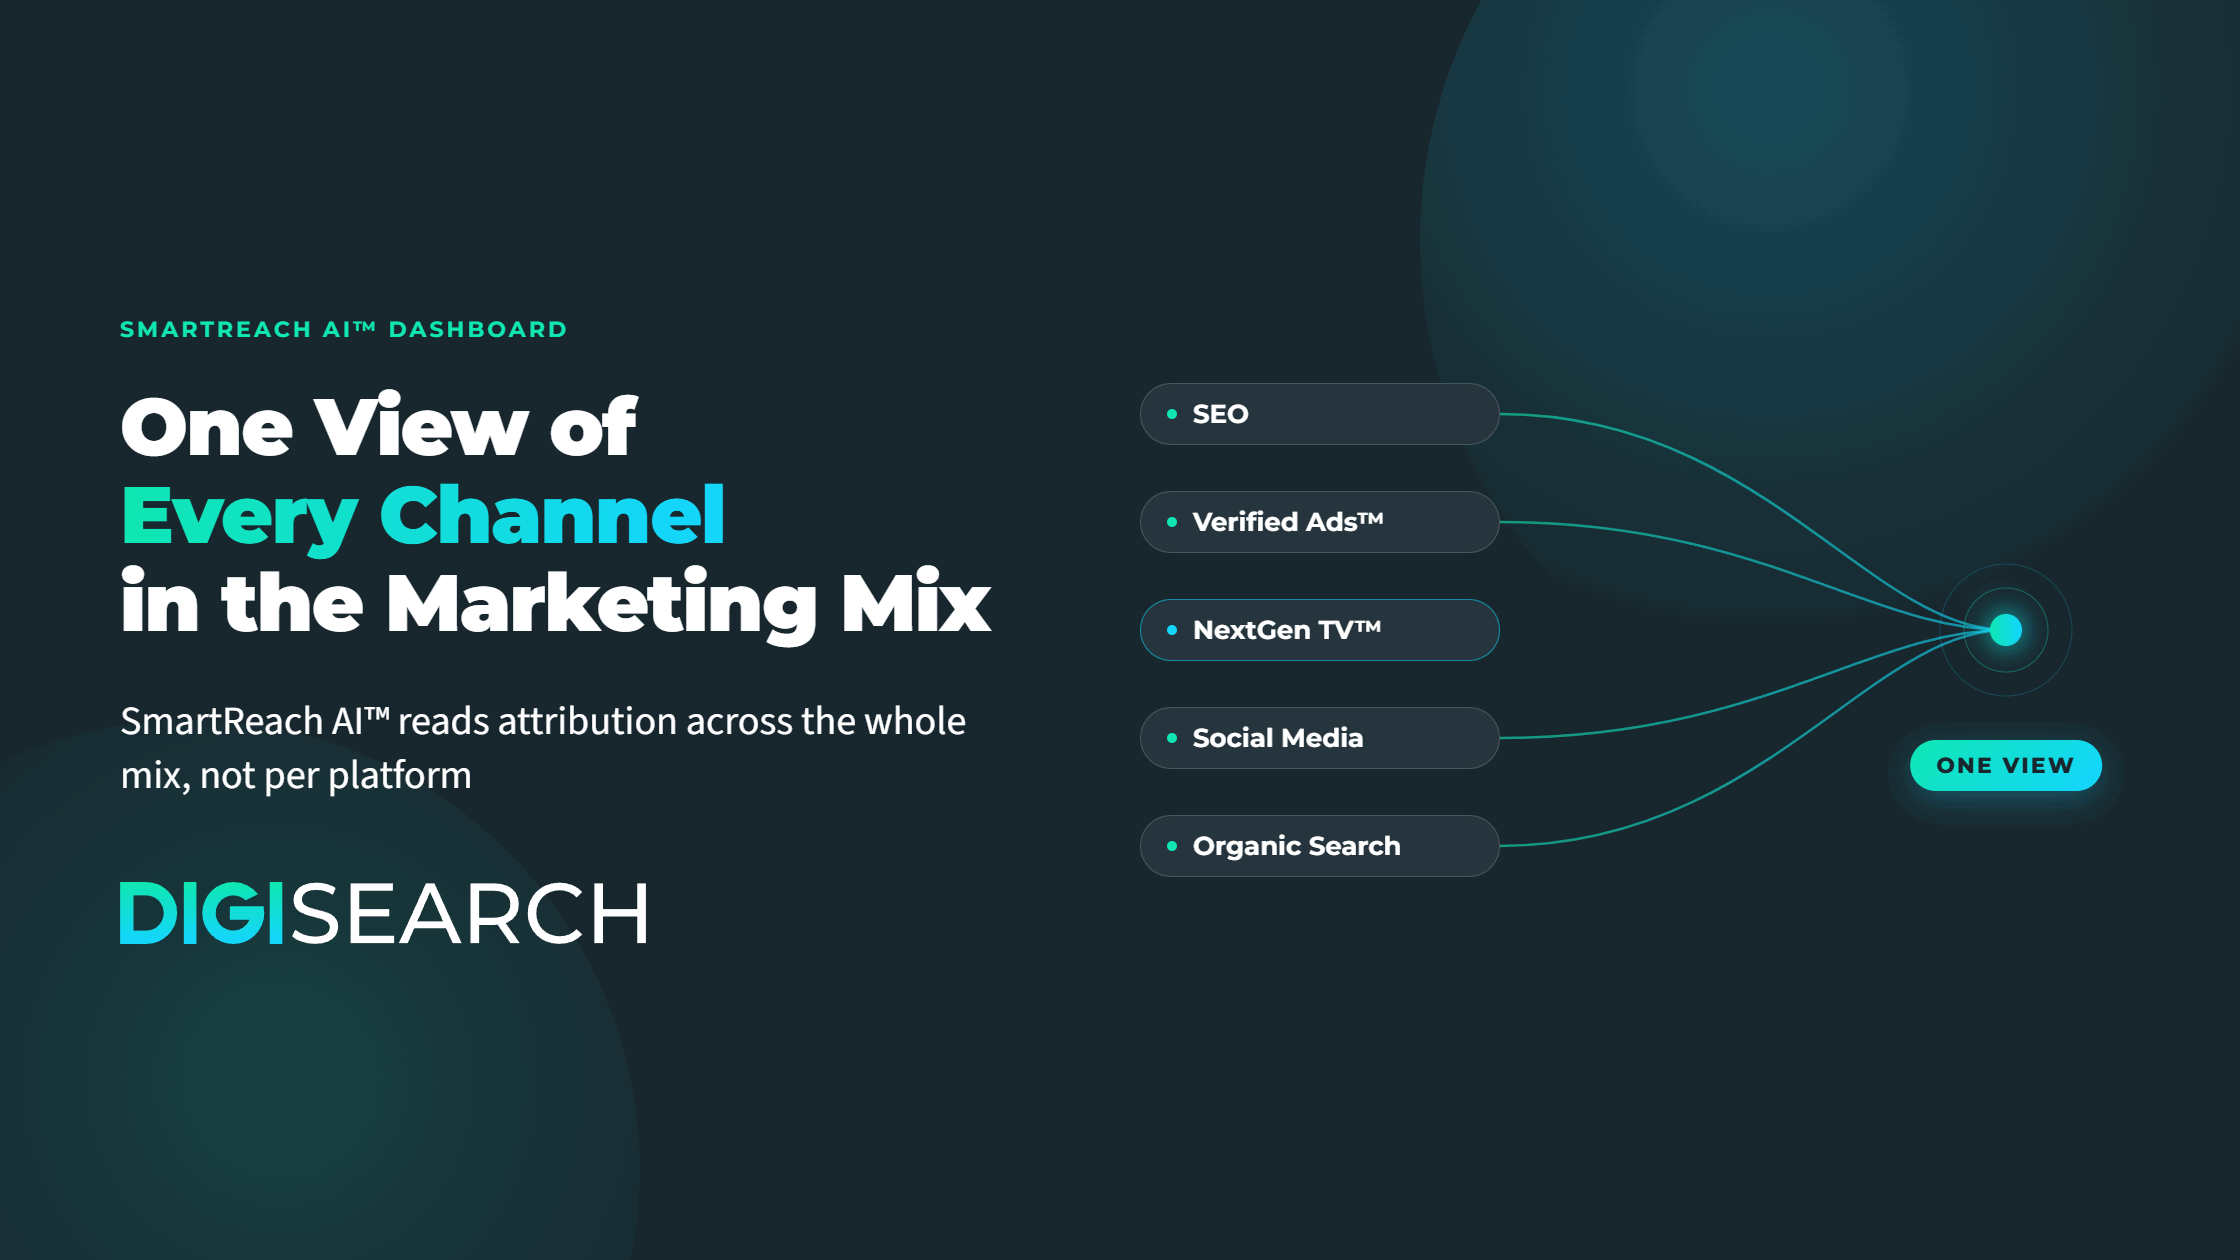
The dashboard shows one view of every channel in a practice’s SmartReach™ mix. Search Ads, Verified Ads™, NextGen TV™, Social Ads, organic search, and Google Business Profile activity, all surfaced in one place with attribution the practice can act on.
That means three things.
Patient inquiries appear alongside the channel actually responsible for them, not just the channel that got the last click before the phone rang.
Channel roles become visible. Awareness channels like NextGen TV™ show up as the force behind organic booking volume, not as a line item with no direct calls attached. Retargeting shows up as the closer it usually is. Verified Ads™ shows up as the high-intent slot it holds.
Spend and outcome sit next to each other, per channel, with the relationships between channels made visible rather than hidden.
The dashboard is the layer that turns a set of running campaigns into a set of connected decisions.
Why One View Changes Decisions
Practices that see their whole mix in one place make different calls than practices working from five separate reports.
They stop cutting channels that look flat in isolation but carry the ones that look strong. They stop over-investing in the channels that show the loudest last-click numbers. They start scaling the channels that do the work behind every other channel’s performance. A case study of that pattern in action lives here: The Invisible Engine, where NextGen TV™ spend for a Naperville practice fed organic channels that produced most of the revenue.
That kind of pattern is invisible to a stack of five reports. It is the default view on the SmartReach AI™ dashboard.
What Practices Should Expect
A dashboard is only as useful as the decisions it changes. The SmartReach AI™ dashboard is built to change three:
What to invest in next month, based on which channels are actually feeding the practice’s booked patient volume.
What to change now, based on where inquiries are sitting without becoming appointments.
What to expect over the next quarter, based on trends the practice can see rather than infer.
None of those decisions look identical from practice to practice. A specialty practice running high-value implant campaigns pulls different signals from the same dashboard than a family GP filling hygiene chairs. A group practice evaluating one market against another reads different columns than a solo practice deciding whether to add a second location.
Every practice sees the same interface. What that interface tells a practice to do next varies with the channel mix, the spend level, and the inquiry volume in play.
That variation is not a limitation of the dashboard. It is the reason the dashboard exists. Marketing decisions worth making are practice-specific by definition, and the dashboard is the view that lets a practice owner see their own situation clearly enough to act on it.
What that view surfaces for a specific practice, on a specific day, with a specific mix of channels running, depends on the current channel mix, the current spend level, and the current inquiry volume. Those three variables determine which patterns matter first, which channels are quietly carrying the mix, and which decisions the dashboard will bring forward. That is the conversation the dashboard is designed to make possible, and it starts with a look at the actual numbers rather than a demo of the interface.
Bring the current channel mix and spend to a discovery call. That is the conversation this dashboard was built for. Schedule one here.